
Figure 2.
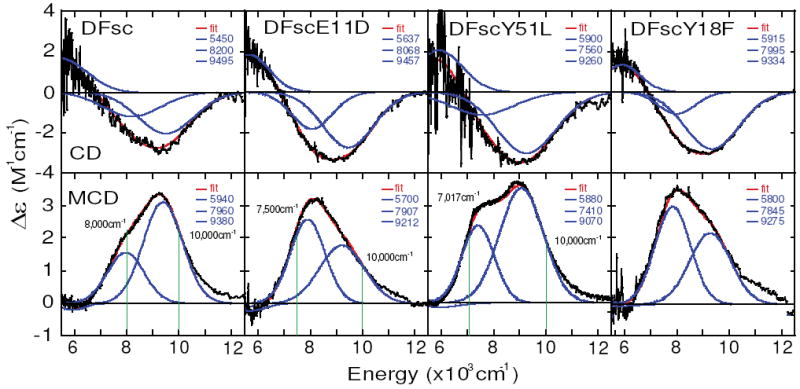
CD/MCD spectra of biferrous DFsc, DFscE11D, DFscY51L and DFscY18F. Top four panels are CD spectra (black) collected at 4°C for each DFsc peptide overlaid with simulated spectrum (red) obtained by summing Gaussian transitions (blue). Bottom four panels are MCD spectra (black) collected at 5 K and 7 T (with 0 T data subtracted out to correct for any baseline effects and LT CD signals) with simulated data (red and blue). Vertical green lines in DFsc, DFscE11D and DFscY51L MCD panels show where VTVH MCD data was collected.