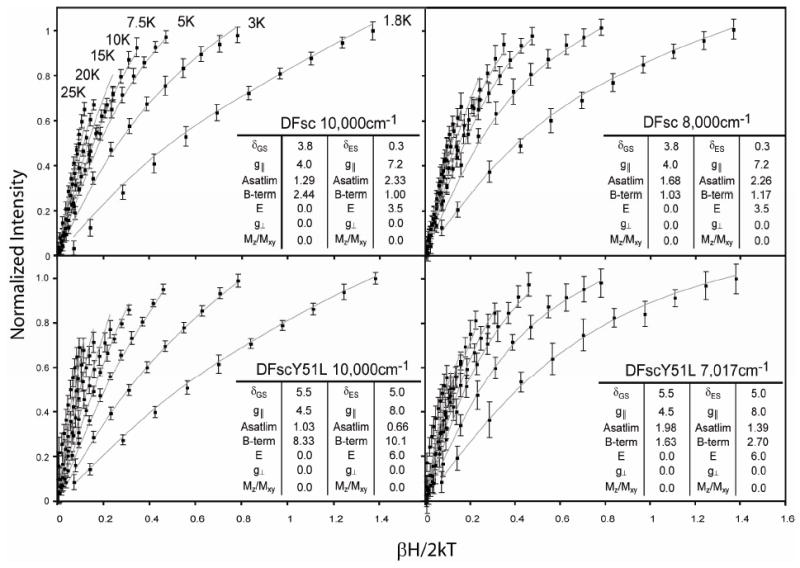
Figure 3.

VTVH MCD data of biferrous DFsc and DFscY51L. Normalized data collected at the energies indicated in each panel are represented by red points with standard deviation in black. Temperatures at which each isotherm was collected are shown in the top left panel. Data was simulated using the doublet model, as described in the text, and is overlaid as blue lines; the parameters extracted from analysis are summarized in each inset.
