
Figure 4.
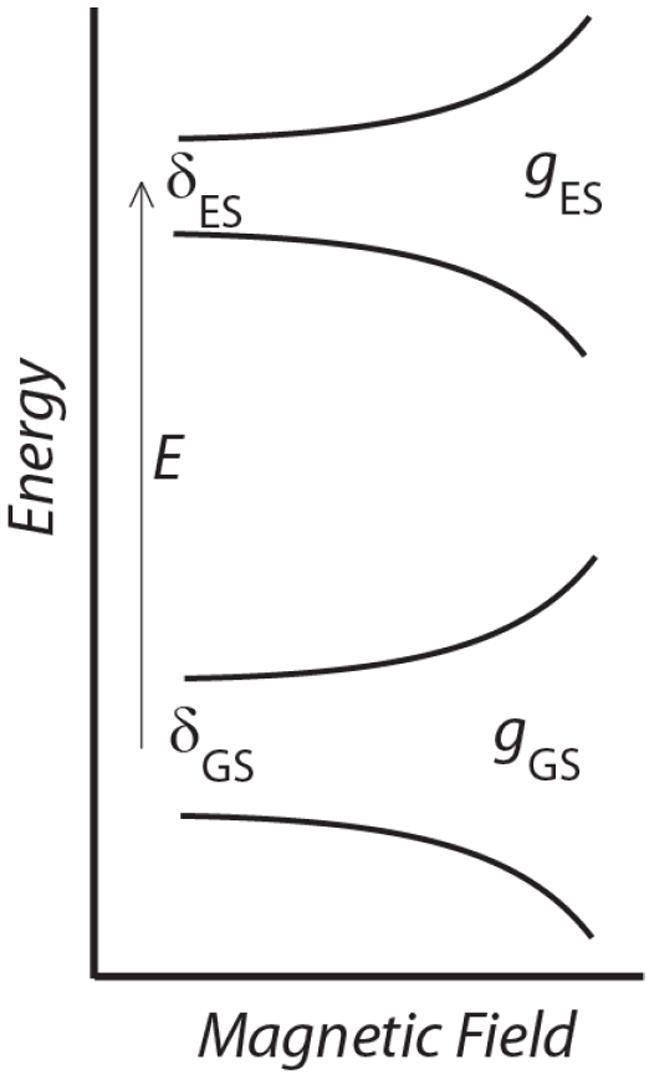
Energy level diagram for doublet model used to simulate biferrous VTVH MCD data. E is the energy spacing between the ground and excited states (GS and ES), gGS and gES are the g-values for the ground and excited states, respectively and δ is the rhombic ZFS parameter.