
Figure 6.
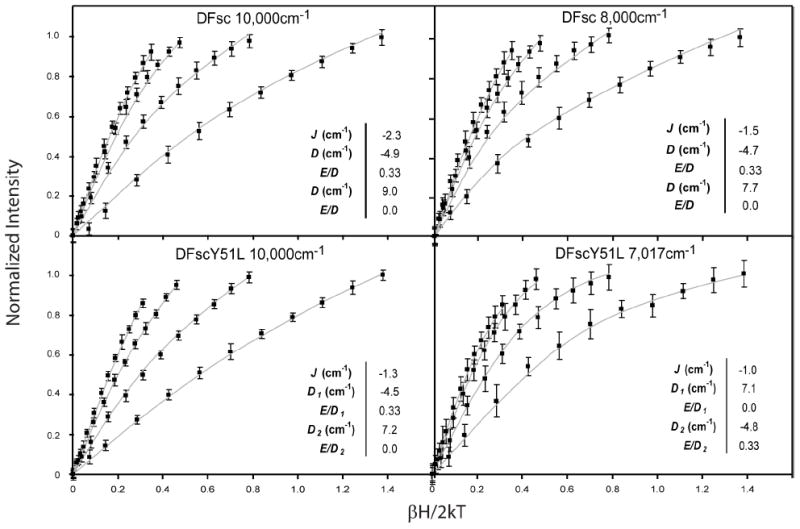
Biferrous VTVH MCD data of DFsc and DFscY51L overlaid with simulations using binuclear Hamiltonian. Each panel shows the four lowest temperature isotherms (data points) collected at on the variant and energy described in each panel. Solid lines show the best fits to the complete data sets (i.e. all isotherms up to 25 K) from spin-Hamiltonian analysis described in the text to the data and extracted parameters are shown in insets. The values reported in the insets correspond to the best fit shown, however Table 2 gives values for each physical parameter based on other fits to the data that are still within the experimental error of the data.