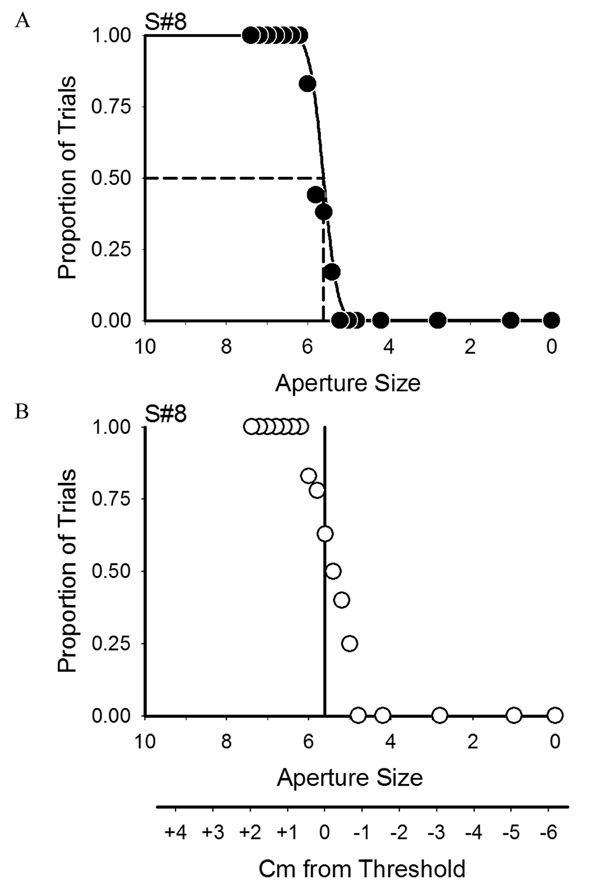
Figure 2.
(A) Proportion of successful reaches (S/(S+F)) for S#8 in one condition plotted by absolute aperture size, overlaid with the affordance function fitted to the success rate. The horizontal dashed line denotes 50% success and the vertical dashed line denotes the aperture size at the 50% success rate (affordance threshold). (B) Proportion of attempted reaches for S#8 plotted by absolute aperture size and normalized to the affordance threshold (lower axis). Solid vertical line denotes the affordance threshold.

