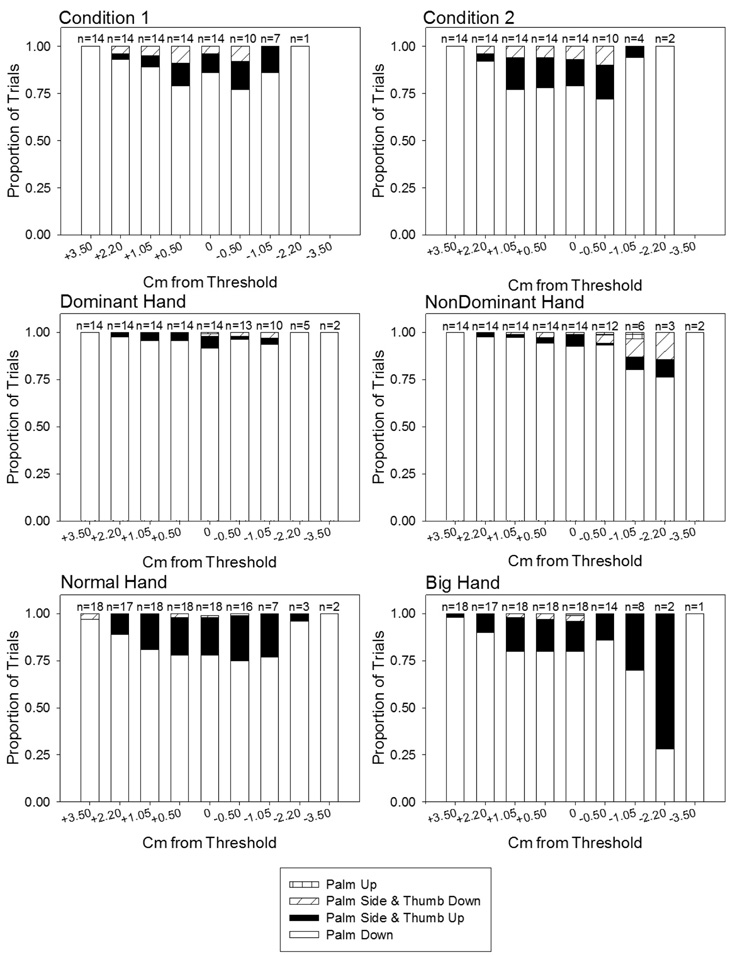
Figure 5.
The distribution of hand orientations within each aperture group for Experiment 1 (top row), Experiment 2 (middle row), and Experiment 3 (bottom row). Vertical stripes indicate palm facing up. Diagonal stripes indicate palm sideways and thumb down. Solid black indicates palm sideways and thumb facing up. Solid white indicates palm facing down. Note, the number of participants contributing data to each aperture group is given above each bar.

