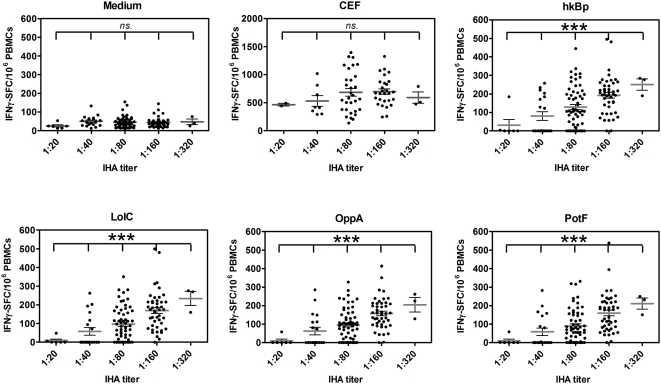
Figure 2. Distribution of specific T cell responses to whole B. pseudomallei and three ABC transporter proteins.
PBMCs from 133 healthy blood donors as described in Figure 1 were classified according to plasma IHA antibody titers; 1∶20, 1∶40, 1∶80, 1∶160 and 1∶320 (n = 6, 19, 60, 45 and 3, respectively) and analyzed for specific (CsA sensitive) IFN-γ secreting spots assayed by ELISPOT in response to medium alone, 2 µg/ml pool viral peptides (CEF), whole B. pseudomallei (hk Bp) and Bp derived ABC transporter proteins (LolC, OppA and PotF). *** P<0.0001, ns-non statistical significance (one way ANOVA).

