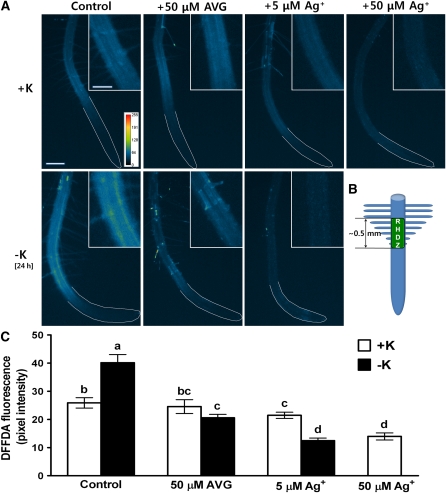
Figure 2.
Ethylene Inhibitors Reduce Low K+-Induced ROS Production.
(A) Pseudocolor images of ROS fluorescence are shown for K+-sufficient (+K, 1.75 mM K+) roots and for K+-starved (no K+) roots with or without Ag+ and AVG. Roots were deprived of K+ for 24 h and treated with ethylene inhibitors for 2 h. ROS images were collected following staining of 3-d-old roots with 20 μM DFFDA. Yellow and red colors indicate higher ROS production (see scale inset in pixel intensity). Insets show enlargements of the root hair differentiation zone. White lines were drawn by hand to outline the root. Bar = 200 μm; bar in inset = 100 μm.
(B) Diagram showing the RHDZ, which is the region where ROS was quantified in (C).
(C) Quantified data from representative images shown in (A) (n = 7 to 10 images of individual seedlings ± se).
Results from one of three independent experiments are shown here. Means that have different letters at the top of each bar are significantly different (P < 0.05; t test).

