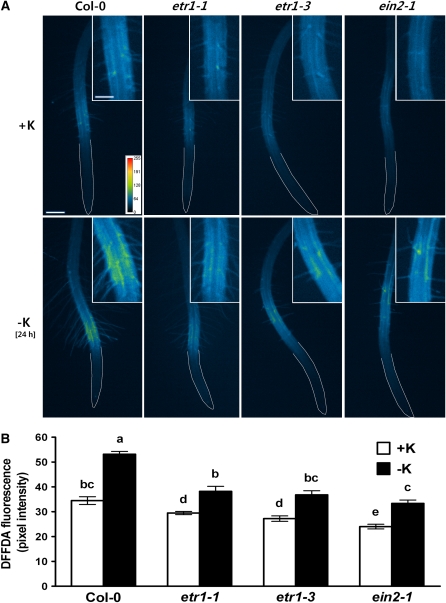
Figure 4.
K+ Deficiency Induces Increased ROS in Ethylene-Insensitive Mutants.
(A) Pseudocolor images of ROS fluorescence are shown for etr1-1, etr1-3, and ein2-1 roots grown on K+-sufficient (+K, 1.75 mM K+) and K+-deficient (no K+) media. Roots were deprived of K+ for 24 h. ROS was visualized by staining 3-d-old roots with 20 μM DFFDA. Yellow and red colors indicate higher ROS production (see pseudocolor scale). Inset shows enlargement of RHDZ. White lines show the boundary of roots. Bar = 200 μm; bar in inset = 100 μm.
(B) Quantified data from images as shown in (A) (n = 10 seedlings ± se).
Means that have different letters at the top are significantly different (P < 0.05; t test).

