Figure 1.
The Differentially Regulated Genes after Three Treatments.
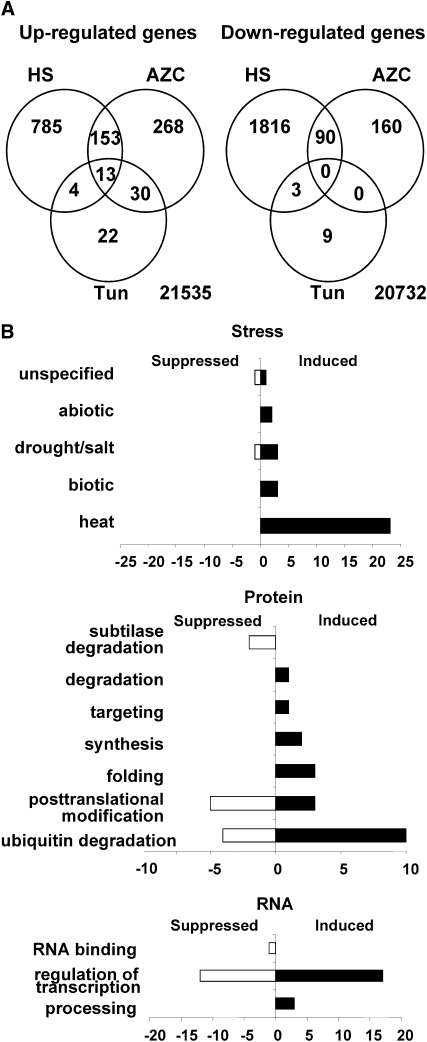
(A) Venn diagram of the differentially regulated genes after three treatments. The numbers of genes showing altered regulation following heat shock (HS), AZC, or tunicamycin treatment in comparison to their respective controls are shown in Venn diagrams. Numbers at the bottom right indicate genes showing no significant (P ≥ 0.05) changes for any of the treatments.
(B) Functional categorization of differentially regulated genes by CPR. CPR upregulated or downregulated genes were grouped according to their known or predicted function using the MapMan functional classification system (Thimm et al., 2004). The three main categories (stress, protein, and RNA) belong to MapMan level 1, while the others belong to level 3. Black bars represent upregulated genes, and white bars represent downregulated genes.

