Figure 2.
Response of HSP70A and HSP70B Promoters and Their Variants to Heat Shock and Protein Stress.
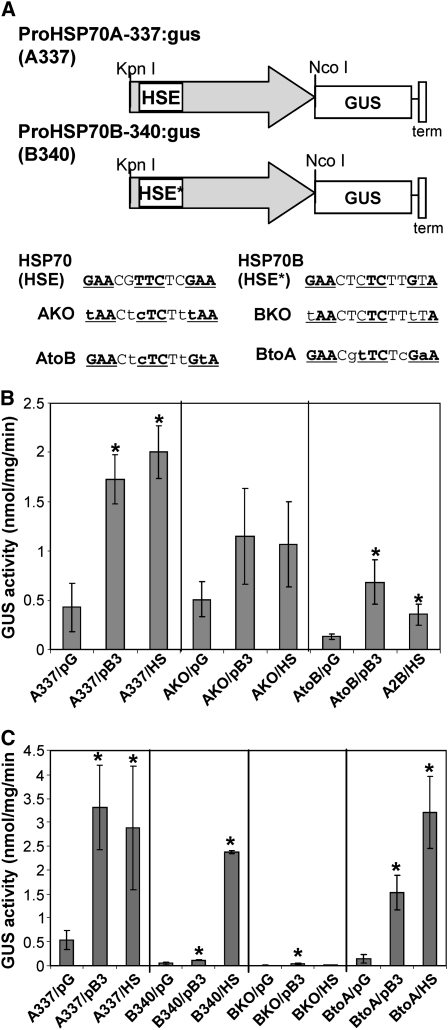
(A) Promoter:reporter constructs and HSE mutants. Promoter:reporter Agrobacterium binary constructs were made for HSP70A (A337) and HSP70B (B340) using 337 and 340 bp, respectively, of the upstream genomic DNA (gray arrow) fused to GUS and the CaMV 19S terminator (term). Promoter variants were created by site-directed mutagenesis of the HSE in the HSP70A promoter and the HSE-like (HSE*) sequence of the HSP70B promoter. The original sequences are shown at the top. The consensus sequence of HSEs is shown in bold, and the relative positions are underlined. The mutated nucleotides are shown in lowercase.
(B) Promoter responses in N. benthamiana measured as GUS activity following Agrobacterium infiltration of the constructs. Promoter constructs were coinfiltrated with pB3, which overexpresses a cytosolically targeted Arabidopsis protein (At5g08290) to induce the CPR or with an empty vector (pG; nonstressed) as a negative control. Infiltrated tissues were also heat shocked (HS) as a positive control for HSP70A and HSP70B induction. The responses of the HSP70A HSE knockout (AKO) mutation or the HSP70A promoter mutant that substituted HSE with HSE* (AtoB) to the three treatments in comparison with the wild-type minimal promoter for HSP70A (A337) are shown. Assays were performed in triplicate on individual extracts of two infiltrated leaves. Bars indicate ±sd.
(C) Similar experiments to those in (B) but showing the responses to the three treatments of the HSE* knockout mutation in the HSP70B promoter (BKO) or the substitution of the HSE* with HSE in the HSP70B promoter (BtoA) in comparison with the HSP70B (B340) promoter. Responses of the A337 promoter to protein expression (pB3) or heat shock (HS) were included (left panel) as positive controls in the same experiment. Assays were performed in triplicate on individual extracts of two infiltrated leaves. Bars indicate ±sd. Statistical comparisons were made with the coinfiltrated empty plasmid (pG) in each case. P values < 0.05 are indicated with asterisks.

