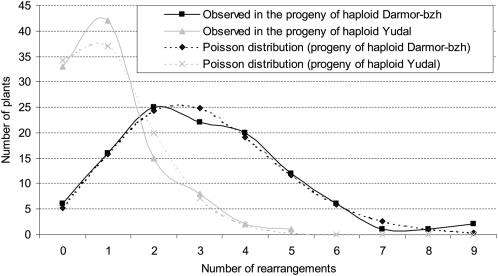
Figure 2.
Distribution of the Number of Rearrangements per Individual Offspring in the Progeny of Darmor-bzh versus Yudal Haploids.
Two Poisson distributions (diamond for Darmor-bzh and cross for Yudal) are used to model the number of rearrangements per plant. The average number of missing regions per plant (per progeny) is used as the average rate for each of the two distributions.

