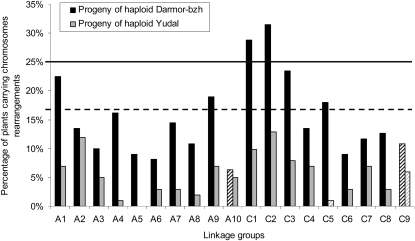
Figure 3.
Percentage of Plants with Rearrangements for Each Chromosome in the Progenies Darmor-bzh and Yudal Haploids.
The solid line indicates the expected proportion of plants with rearrangements when chromosomes systematically undergo a cross-over during haploid meiosis. The dashed line indicates the lowest limit of the confidence interval around this expected proportion when α = 5%. Striped black and gray bars (such as for C9) indicate the linkage groups that were poorly covered in Darmor-bzh and Yudal, respectively.

