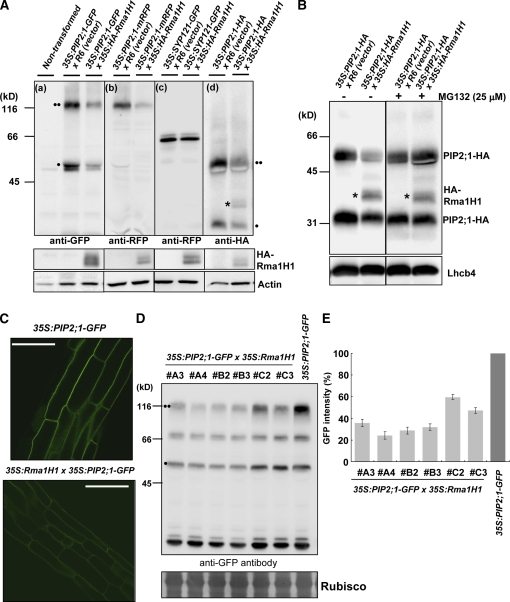
Figure 6.
HA-Rma1H1 Reduces PIP2;1 Protein Levels in a 26S Proteasome-Dependent Manner.
(A) HA-Rma1H1-induced reduction of PIP2;1 level. Protoplasts were cotransformed with indicated constructs, and protein extracts were analyzed by protein gel blotting using various antibodies as indicated. Actin levels were detected as a loading control with anti-actin antibody. Two circles indicates PIP2;1 in dimeric form, while one circle indicates PIP2;1 as monomer. The asterisk shows HA-Rma1H1, which was detected at the same time as PIP2;1-HA because it is also HA tagged.
(B) Effect of MG132 on PIP2;1-HA levels. Protoplasts cotransformed with 35S:PIP2;1-HA and 35S:HA-Rma1H1 were incubated with MG132, and protein extracts were analyzed using anti-RFP and anti-HA antibodies. Lhcb4 levels were detected as a loading control with anti-Lhcb4 antibody.
(C) to (E) Reduction of PIP2;1-GFP in 35S:Rma1H1/35S:PIP2;1-GFP double transgenic plants. PIP2;1-GFP levels were determined by fluorescent microscopy (C) or by protein gel blot analysis using anti-GFP antibody (D). The degree of PIP2;1-GFP reduction in six independent DT lines was quantified by measuring the intensity of the three bands of PIP2;1-GFP from the protein gel blotting (E). RbcS stained with Coomassie blue was used as a loading control. Bars = 50 μm. Error bars are ±sd (n = 5).
[See online article for color version of this figure.]

