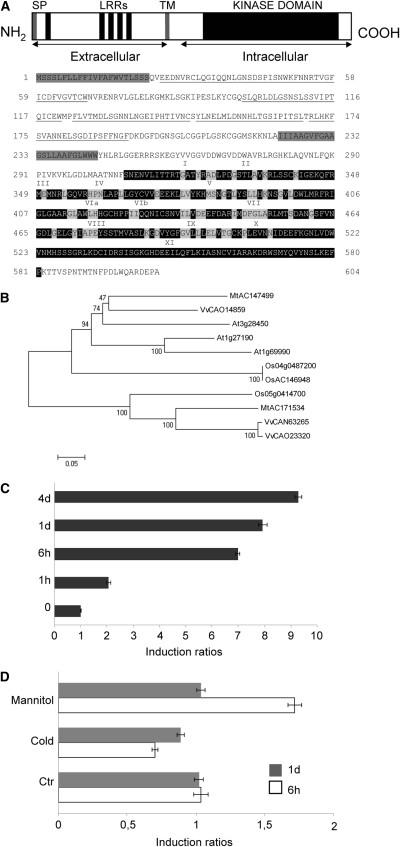
Figure 1.
An LRR-RLK Is Induced by Salt Stress in M. truncatula Jemalong A17.
(A) Predicted amino acid sequence of Srlk. Hydrophobic regions corresponding to the signal peptide sequence and the transmembrane region (gray boxes), the LRRs (amino acids underlined), and the kinase domain (black) are indicated. Roman numerals indicate the 11 characteristic subdomains of protein kinases. Letters shaded in gray indicate amino acids highly conserved among protein kinases.
(B) Phylogenetic relationship among Srlk homologs. Phylogram of deduced full-length protein sequences of Srlk homologs constructed with the MEGA4 software (Tamura et al., 2007). The bootstrapping value (out of 10,000 samples) for each node, obtained with the same software, is shown. Species are as follows: Mt, Medicago truncatula; At, Arabidopsis thaliana; Vv, Vitis vinifera, and Os, Oryza sativa.
(C) Srlk expression levels in response to salinity treatments. M. truncatula Jemalong A17 roots (4-d grown) were transferred to 150 mM NaCl for different times. Real time RT-PCR analysis of Srlk expression in roots at 0, 1 h, 6 h, 1 d, and 4 d of treatments is shown.
(D) Srlk expression levels in response to mannitol (300 mM) and a cold (4°C) stress during 6 and 24 h. For (C) and (D), histogram represents quantification of specific PCR amplification products for Srlk gene normalized against the constitutive control actin11. Numbers on the x axis indicate fold induction of gene expression in treated compared with untreated samples. A representative example out of two biological experiments is shown, and error bars represent sd between three technical replicates.

