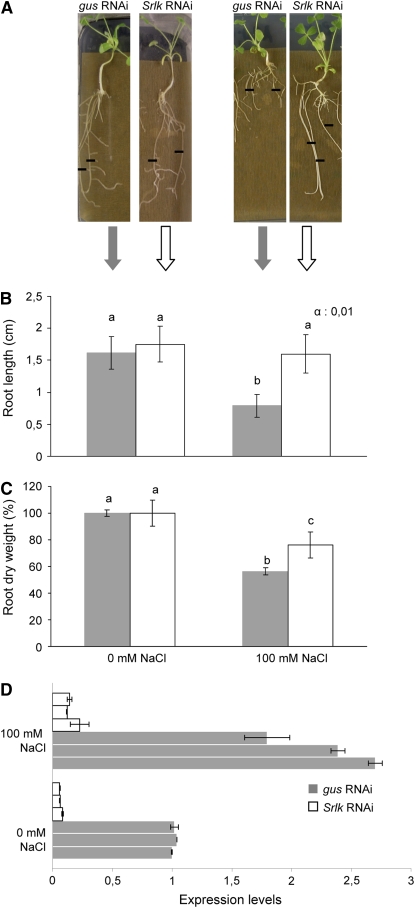
Figure 2.
Functional Analysis of the Srlk Gene Using RNAi.
(A) Representative images of gus-RNAi and Srlk-RNAi A. rhizogenes–transformed M. truncatula roots 6 d after transfer to control medium (left) or 100 mM NaCl (right). Black lines indicate the position of root tips at the moment of transfer to the salt or control medium. Similar root lengths were observed for both plants in control conditions.
(B) Quantification of mean root growth of independent transgenic roots transformed with the constructs mentioned in (A) and grown 6 d on media without salt (left graph) or supplemented with 100 mM NaCl (right graph). A representative example out of three biological experiments is shown (n > 30 per construct and condition per experiment). The different letters indicate mean values significantly different between gus-RNAi and Srlk-RNAi roots (Student's t test, P < 0.001).
(C) Quantification of root dry weights of Srlk-RNAi or gus-RNAi plants under salt stress or control conditions after 15 d. The different letters indicate mean values significantly different using the Kruskal and Wallis statistical method (n = 20). For (B) and (C), error bars indicate the interval of confidence (α = 0.01).
(D) Real-time RT-PCR analysis of expression levels of Srlk in pools from three independent Srlk-RNAi (white bars) and three gus-RNAi transgenic lines (gray bars) treated or not with salt. Values were normalized against the actin gene, and error bars are sd.

