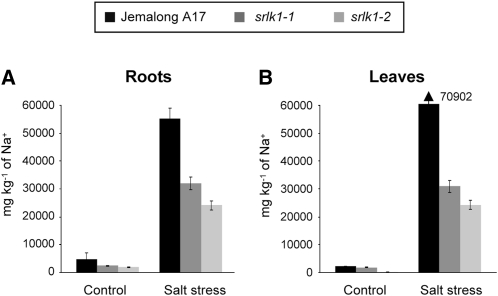
Figure 6.
Sodium Accumulation in Different Tissues of Srlk Mutants.
Sodium concentrations were determined in roots (A) and leaves (B) of plants treated twice with 100 mM NaCl during 7 d (a total of 14 d) and in untreated plants using inducted coupled plasma optical spectrophotometry. Results are expressed in mg kg−1 (n = 20 per plant line), and two biological replicate experiments were performed. Error bars indicate the interval of confidence (α = 0.01).

