Figure 2.
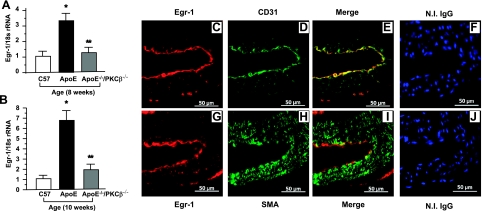
Evaluation of induction of Egr-1 transcripts and antigen in apoE−/− and PKCβ−/−/apoE−/− mice. A, B) Real time PCR analysis of RNA extracted from aorta retrieved from C57BL/6, apoE−/− and PKCβ−/−/apoE−/− male mice at age 8 wk (A) and 10 wk (B). Data are calculated by 2−ΔΔCt method and are presented as the fold induction of mRNA for Egr-1 normalized to 18s rRNA and relative to control C57BL/6. *P < 0.0001 vs. aortas of C57BL6 mice. **P < 0.0001 vs. aortas of apoE−/− mice. C–E) Immunofluorescence double-stained on the sections of aorta from apoE−/− male mice at age 8 wk with anti-Egr-1 IgG (red; C) and anti-CD31IgG (green; D); merged image is also shown (E). F) No immunofluorescence stained with nonimmune IgG was shown, but nuclei were stained with DAPI (blue). G–I) Immunofluorescence double-stained on the sections of aorta from apoE−/− male mice at age 8 wk with anti-Egr-1 IgG (red; G) and anti-α-smooth muscle actin (green; H); merged image is also shown (I). J) No immunofluorescence stained with nonimmune IgG was shown, but nuclei were stained with DAPI (blue). Scale bars = 50 μm.

