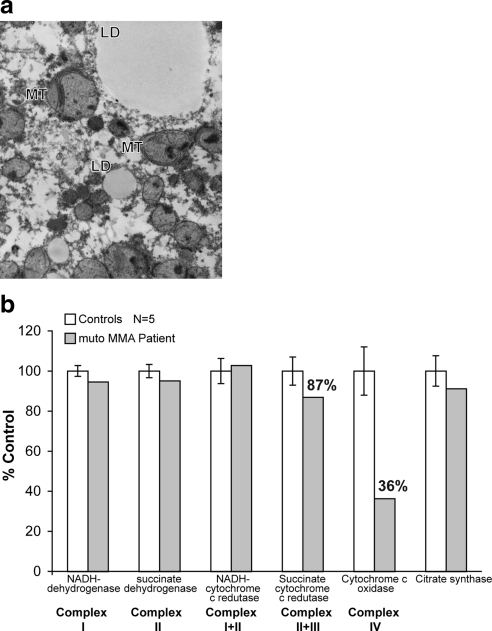
Figure 4.
a) Electron microscopy of a mut methylmalonic acidemia patient liver (×10,000). Lipid droplets (LD) and mitochondria (MT) are enlarged, have a pale matrix, and some have lamellar inclusions. b) Respiratory chain activity in a mut methylmalonic acidemia patient liver extract compared to controls (n=5). Specific enzyme activities were measured as described in text and normalized to controls. The mut methylmalonic acidemia patient liver shows diminished activities of complex IV and possibly complex II + III compared to controls.

