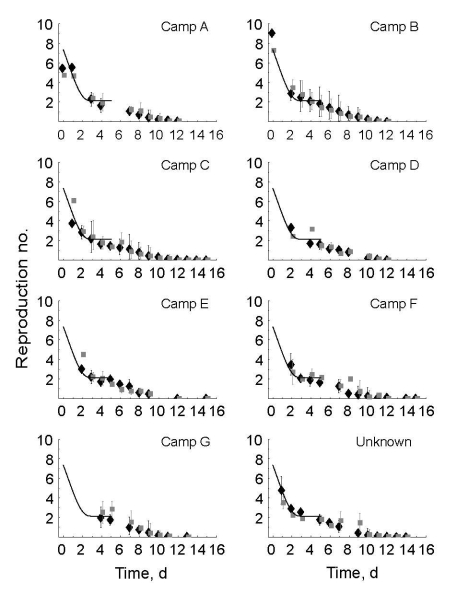
Figure 4.
Time course of the reproduction number for norovirus for 7 camps of an international scout jamboree. Black diamonds show the mean value of the reproduction number without additional information about population structure and genotypes. Gray boxes show the mean value of the reproduction number when additional information about population structure and genotypes is used. The vertical lines show the mean minimum and maximum reproduction number over all sampled transmission matrices. The solid black line represents the time course of reproduction numbers if decrease in the mean reproduction number results from an instantaneous decline in transmission when enhanced hygiene measures begin. The camps are in order of the day of symptom onset of the first case-patient. Top panels indicate first introduction, bottom panels the last introduction.

