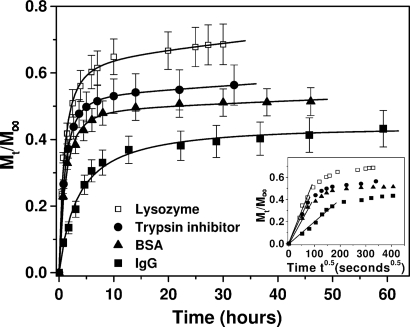
Fig. 2.
Release profiles for lysozyme (□), trypsin inhibitor (●), BSA (▴), and IgG (■) through the self-assembling peptide hydrogel in PBS (pH 7.4) at room temperature. Data points represent the average of 4 or 8 samples with calculated SD values that are <12%. (Inset) Protein release plotted as a function of the square root of time showing a biphasic diffusion mechanism. The initial linear part of the plots represents simple diffusion of the proteins through the peptide hydrogel, and it is used to calculate diffusion coefficients based on Fick's law (Eq. 2).

