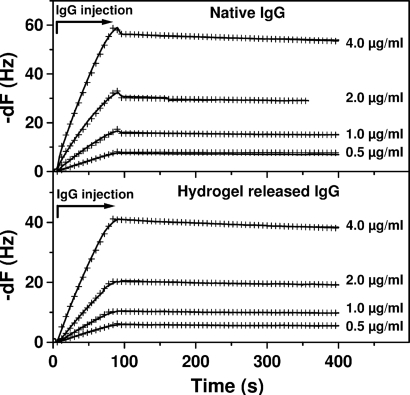
Fig. 6.
QCM time-dependent frequency changes, -dF, upon association (binding) and dissociation of the monoclonal anti-rhodopsin IgG to immobilized rhodopsin (antigen) with different concentrations of IgG. Time 0 represents injection of IgG in the flow channel (kinetic data were shifted for comparison). Arrow indicates the antibody injection time course and the corresponding association phase. The biosensor signal (solid line) increases upon IgG injection and decreases upon injection of the buffer, which rinse the surface and dissociate the IgG bound to the antigen. The similarity of the calculated rate constants and of the affinity constants suggests that the functional characteristics of IgG were not affected upon release through the peptide hydrogel. Global fitting of the binding data are represented by the cross-mark lines.

