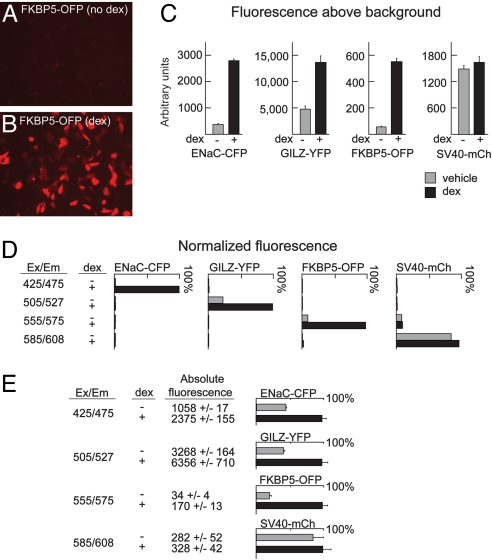
Fig. 1.
Measurement of activity from 4 promoters simultaneously with fluorescent reporters. (A and B) Fluorescence microscopy of A549 cells transfected with pFKBP5-OFP and treated with dex (100 nm) as indicated. (C) The peak fluorescence of A549 cells transfected with the indicated reporter constructs and treated with dex as indicated was measured by using a monochrometer-based plate reader. (D) Cells were transfected with each FP reporter construct and treated with dex as indicated. Fluorescence above background was measured sequentially with each of the 4 optimized excitation/emission pairs. Values above background measured with the optimal setting for each reporter with dex treatment were normalized to 100%. Note that minimal fluorescence was detected for each reporter at nonoptimal settings. (E) Fluorescence from cells in 96-well dishes transfected with all 4 FP reporters was sequentially measured by using the 4 excitation/emission pairs. Mean and standard deviations of absolute fluorescence measured from 8 wells treated with and without dex are graphed as percent activation.

