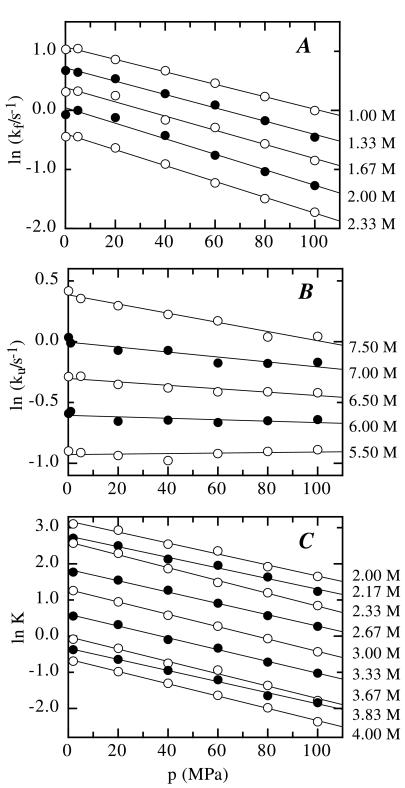
Figure 3.
Pressure dependence of the microscopic rate constants, kf (A) and ku (B), and the equilibrium constant, K (C) at various GdmCl concentrations indicated on the right. Microscopic rate constants were determined by fitting the data in Fig. 2A to Eq. 12. The equilibrium constants were taken from Fig. 2B by using Eq. 8. The lines represent fits according to Eq. 13 for the microscopic rate constants and according to Eq. 9 for the equilibrium constant. The results of the fits are shown in Fig. 4A.

