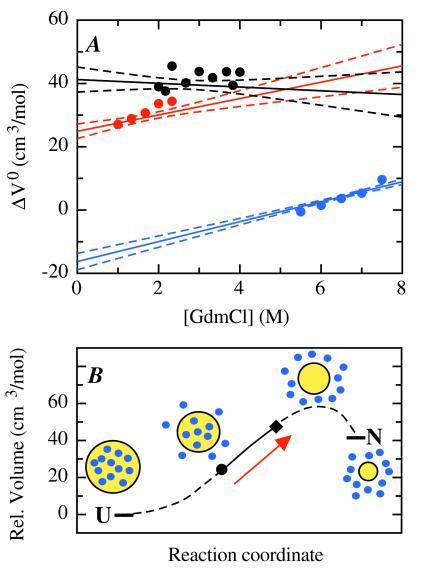
Figure 4.
(A) GdmCl dependence of the activation volumes and the reaction volume for tendamistat folding at 50 mM Gly/HCl, pH 2.0, 35°C. The data points show the activation volumes for refolding (red) and unfolding (blue) and the reaction volume (black) determined in individual fits of the kinetic and equilibrium data displayed in Fig. 3. The lines represent the results from the global fit (solid line) of kinetic and equilibrium data shown in Fig. 2 together with the 2σ confidence intervals (dashed lines). The parameters of the global fit are: ΔG0 (H2O, 0.1 MPa) = −16.38 ± 0.14 kJ/mol; m(0.1 MPa) = 4.62 ± 0.04 (kJ/mol)/M; ΔV0(H2O) = 41.4 ± 2.0 cm3/mol; n = −0.6 ± 0.7 (cm3/mol)/M; kf(H2O, 0.1 MPa) = 10.2 ± 0.3 s−1; mf(0.1 MPa) = 3.04 ± 0.03 (kJ/mol)/M; ku(H2O) = 1.36 ± 0.06 × 10⁻² s−1; mu(0.1 MPa) = −1.58 ± 0.02 (kJ/mol)/M; ΔVf0‡(H2O) = 25.0 ± 1.2 cm3/mol; nf = 2.5 ± 0.6 (cm3/mol)/M; ΔVu0‡(H2O) = −16.4 ± 1.4 cm3/mol; nu = 3.1 ± 0.2 (cm3/mol)/M. The results change only slightly if a pressure dependence of the GdmCl concentration in the range observed for solutions of other monovalent salts is assumed (36). (B) Volume changes along the reaction coordinate of tendamistat folding. The volume of the unfolded state was set to zero. The solid line represents the experimentally determined volume changes. The dashed line represents the hypothetical continuation of the profile to the native state. The symbols on the line indicate the location of the transition state at 0 M GdmCl (●) and 8 M GdmCl (⧫). The transition state moves to higher volumes with increasing GdmCl concentrations as indicated by the arrow. The yellow circle represents the protein and the blue circles the water molecules.

