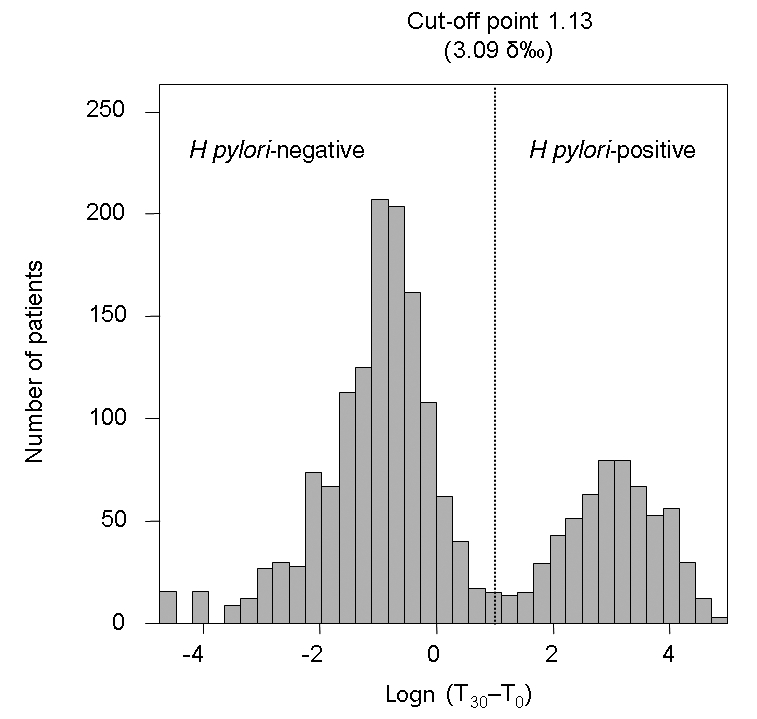
Figure 1).

Cluster analysis in the whole study population. The histogram of the logarithmically transformed 13C urea breath test values shows two distinct populations: Helicobacter pylori-negative and H pylori-positive. The cut-off value was calculated as the point equidistant from the means of the H pylori-negative and H pylori-positive populations. Logn Natural logarithm; T0 Time (0 min) before oral administration; T30 Time (30 min) after oral administration
