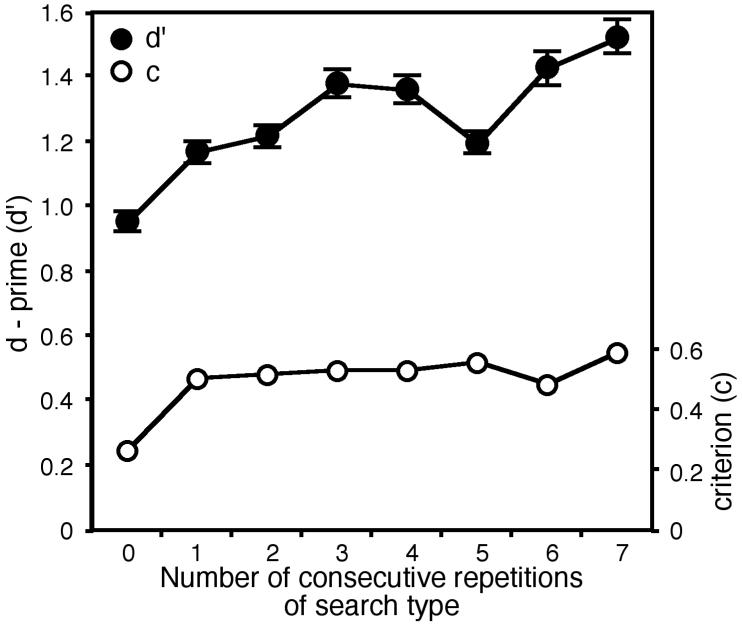
Figure 2.
The mean d’ and c scores for the ten observers from experiment 1, as a function of the number of successive presentations of similar search type trials. The error bars show the standard deviations of the means. For c, the error bars are either similar in size or smaller than the symbols for each mean, and therefore are not shown.

