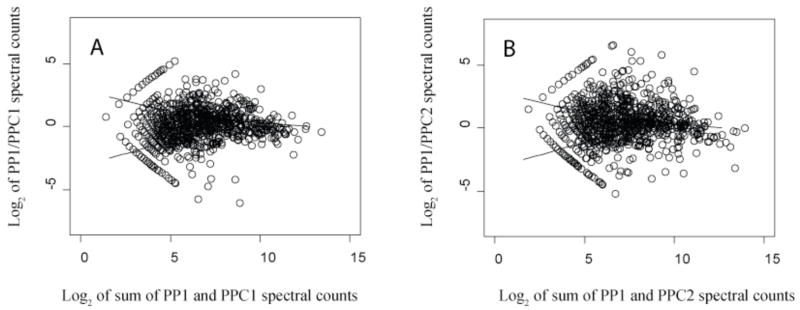
Figure 3.
Scatter plots of protein abundance ratio versus total counts, biological replicates; (A), Log2 of PG_PP1/PG_PPC1 spectral count ratios vs. log2 summed protein level spectral counts; (B), the second biological replicate, PG_PP1/PG_PPC2. The solid curves shown are the LOWESS smoothing curves of the upper and lower boundary of the log2 ratios of PG_PPC1 run1/run2 and and PG_PPC2 run1/run2 technical replicates shown in Fig. 2.

