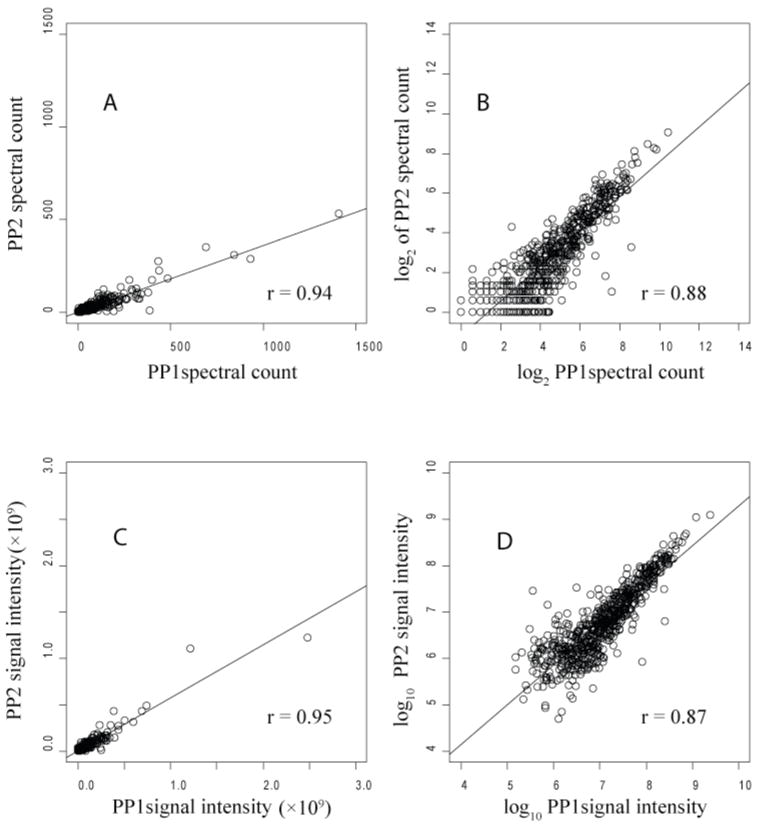
Figure 5.
Spectral count (A, B) and signal intensity (C, D) correlations for two biological replicates, PG_PP1 and PG_PP2, of intracellular P. gingivalis. The Pearson correlation coefficient was 0.94 (A) for spectral counts plotted on a linear scale; on a log2 scale (B) it was 0.88. For the signal intensity measurements the results were about the same, 0.95 on a linear scale (C), and 0.87 on a log10 scale (D). A total of 649 proteins are plotted, representing the most abundant proteins detected and quantified in both replicates.

