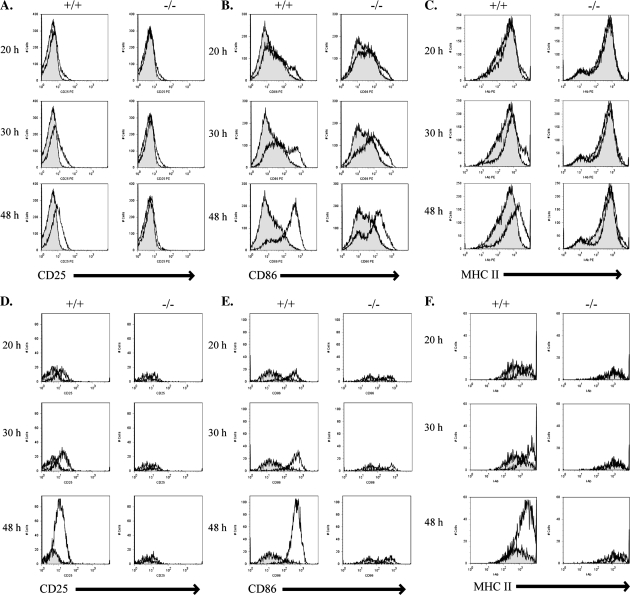
Fig. 5.
In vitro stimulation of antigen receptor signaling in splenic B cells. (A–F) Equal numbers of primary splenocytes from WT (+/+) or c-Abl homozygous KO (−/−) animals were cultured and left either untreated or treated with 50 μg ml−1 anti-IgM F(ab′)2 in vitro for 20, 30 or 48 h and monitored for surface up-regulation of CD25 (A and D), CD86 (B and E) or MHC II (C and F) by FACS analysis. Histograms represent stimulated cells (line) overlaid on unstimulated cells (filled in). (A–C) Gated on total B220+ cells. (D–F) Gated on B220+ and CD23+ cells.

