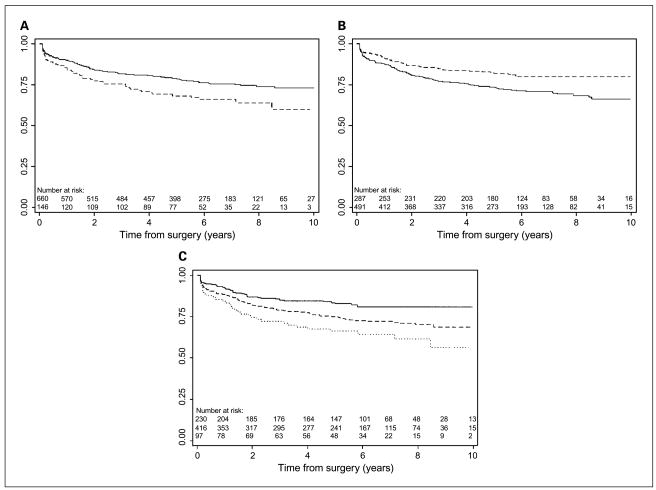
Fig. 3.
Kaplan-Meier recurrence-free probability. A, patients stratified by CRISP-3 positivity, defined as ≥80% of tumor cells positive and immunostaining intensity ≥1.5. Solid line, CRISP-3 negative. Dashed line, CRISP-3 positive. B, patients stratified by MSP positivity, defined as ≥20% of tumor cells positive and immunostaining intensity ≥1.0. Solid line, MSP negative. Dashed line, MSP positive. C, patients stratified by the combination of CRISP-3 and MSP. Solid line, group 1, CRISP-3 negative, and MSP positive. Dashed line, group 2, both CRISP-3 and MSP negative or both CRISP-3 and MSP positive. Dotted line, group 3, CRISP-3 positive and MSP negative.

