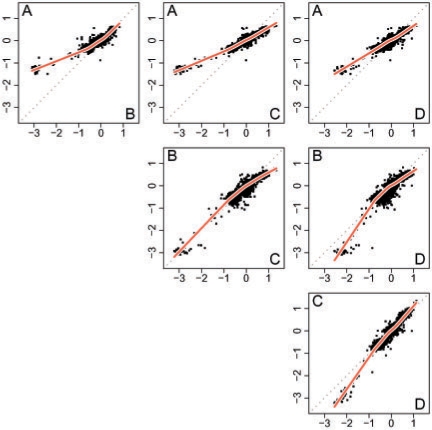
Fig. 3.
Smoothed CNs for the six different pairs of sources. Data from all autosomal chromosomes in one individual is displayed. Each curve depicts the overall pairwise relationship between the two datasets plotted. These curves, which are used only to illustrate the relationships, are fitted using smooth splines with five degrees of freedom.

