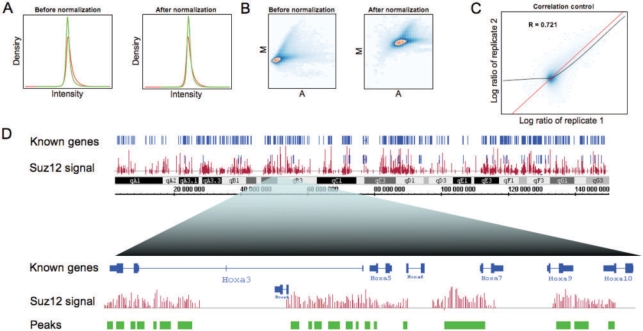
Fig. 1.
Stepwise data analysis of Suz12 ChIP-on-chip in CoCAS. Quality control reports include (A) density plots of immunoprecipitated (IP) DNA, in red, and Input DNA, in green, so as to detect any dye bias; (B) MA plots which allow assessment of normalization quality and probe enrichment; (C) replicate correlation plots, which also help estimate background noise (which shows no correlation at low intensities). (D) Chromosomal view (chromosome 6) of Suz12 IP over input log ratios (in red) via IGB (top), followed by peak detection (green track) on a close up in the Hox cluster region (bottom).

