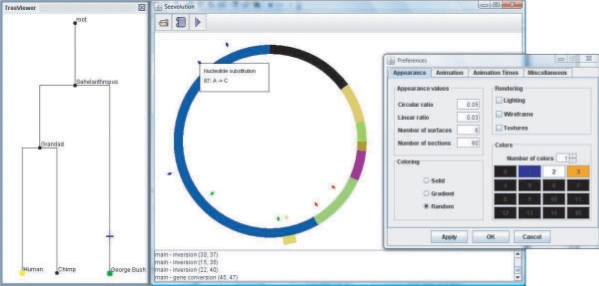
Fig. 2.
Phylogeny of three organisms (left). A circular chromosome colored by rearrangement breakpoints (middle). Blue tick marks indicate nucleotide substitutions, green are insertions, red are deletions and yellow/gold are gene conversions, with one currently being animated at the bottom of the chromosome. Configuration panel for color schemes and animations (right).

