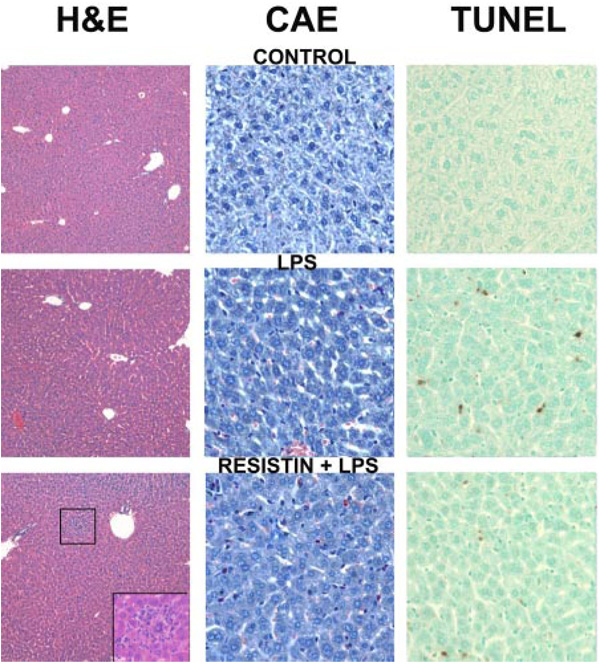
Fig. 1.
Photomicrographs of livers 24 h after LPS and/or resistin injection. Representative photomicrographs of hematoxylin and eosin (H&E), 200× (left); CAE, 400× (center); and TUNEL, 400× (right) stains are shown. Livers from mice that received saline injections are shown to represent both saline- and resistin-treated animals. Inset, bottom left, necroinflammatory area in the resistin/LPS group.

