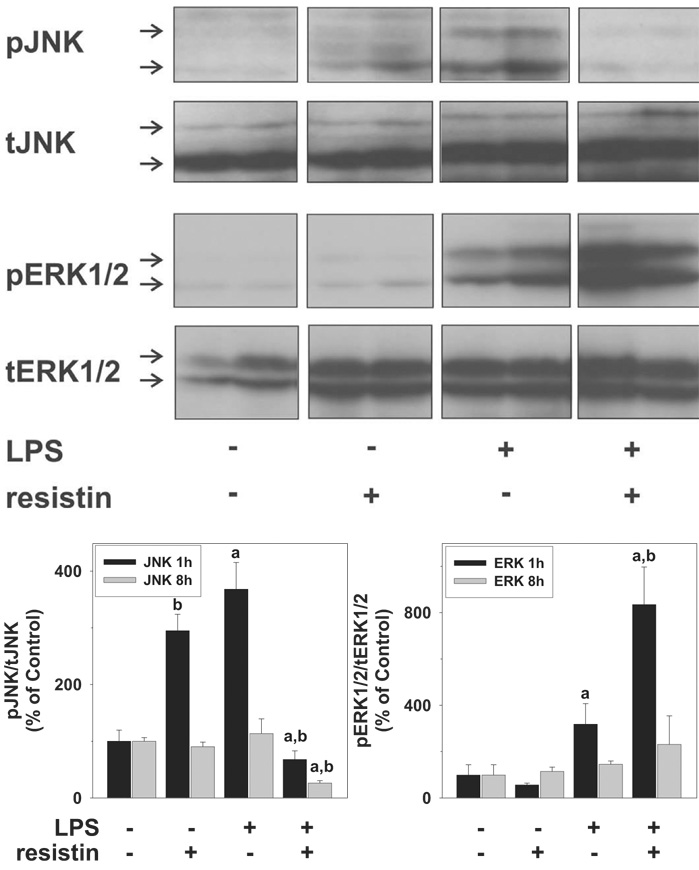
Fig. 4.
Effect of resistin and LPS on the activation of mitogen-activated protein kinases ERK1/2 and JNK in mouse liver. The top panels depict representative bands from the same blot of ERK1/2 (p42/p44) and JNK (p46/p54) of the 1-h time point, and the bottom panel summarizes densitometric analysis of the 1- and 8-h time points. Data are means ± S.E.M. (n = 4–6) and are reported as -fold of control values. a, p < 0.05 compared with the absence of LPS;b, p < 0.05 compared with the absence of resistin.

