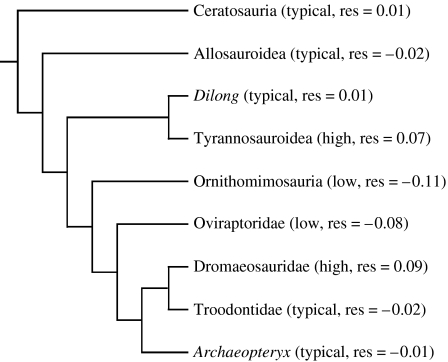
Figure 3.
Phylogenetic distribution of olfactory ratios in theropods (low: lower than predicted values; high: higher than predicted values; typical: near predicted values). Mean of residuals is reported for each clade. Statistical tests for each category (low, high and typical) were conducted on individual residuals reported in table 1. Phylogenetic hypothesis of Holtz & Osmólska (2004).

