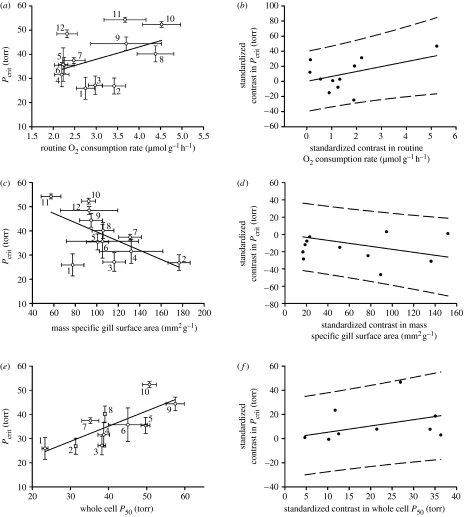
Figure 2.
Relationship between Pcrit and routine (a: y=5.15x+22.44, r2=0.20, p=0.15; b: y=6.52x, r2=0.35, p=0.04), Pcrit and mass-specific gill surface area (c: y=−1.81x+176.03, r2=0.35, p=0.04; d: y=−0.17x, r2=0.38, p=0.03) and Pcrit and whole blood Hb–O2 P50 (e: y=0.63x+9.94, r2=0.57, p=0.01; f: y=0.52x, r2=0.45, p=0.03). Conventional correlations are shown in (a,c,e), and standardized independent contrasts are shown in (b,d,f). Data are represented as mean±s.e. in (a,c,e), and 95% prediction intervals are shown in (b,d,f). 1 torr=0.133 kPa. Cottus asper has been omitted from panels (e) and (f) for reasons outlined in Henriksson et al. (2008). Numbers 1–12 represent different species: (1) Oligocottus maculosus, (2) Chaetopsylla globiceps, (3) Oligocottus snyderi, (4) Enophrys bison, (5) Artedius fenestralis, (6) Artedius lateralis, (7) Leptocottus armatus, (8) Scorpaenichthys marmoratus, (9) Blepsias cirrhosus, (10) M. scorpius, (11) C. asper, and (12) Artedius harringtoni.

