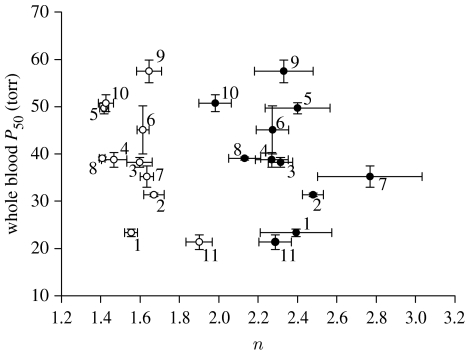
Figure 3.
Relationship between Hb–O2 P50 and Hill's coefficient (n) measured in whole blood (open circles) and stripped haemolysates (filled circles). Error bars around the symbols represent s.e. for x- and y-values. See figure 2 caption for more details.

