Figure 3.
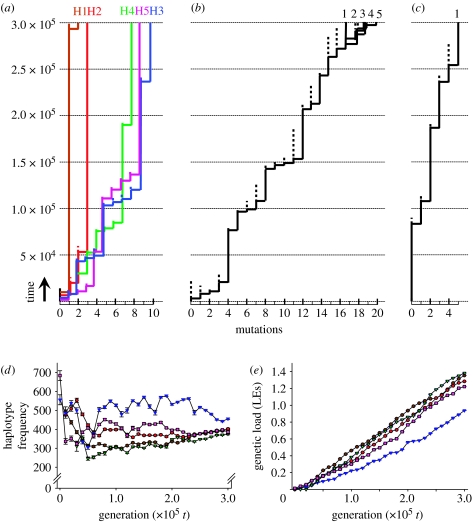
Genealogies, haplotype frequencies and genetic loads of simulated populations over 3×10⁵ generations. Each step in the genealogies (a–c) represents a mutation in the MHC gene. Total number of accumulated MHC mutations and time are shown on the x- and y-axes, respectively. Dotted vertical lines represent the ancestral MHC allele that is replaced by its derived mutant (solid vertical line). Only ancestral alleles with extant descendants are shown. (a) ABC evolution results in long terminal branches and large differentiation between extant alleles. (b) Overdominant selection results in a rapid turnover rate of alleles and little allelic differentiation. (c) Neutral evolution results in low level of polymorphism in the population (see table S1 and text S1 in the electronic supplementary material). (d) Marked unevenness in haplotype frequencies in the population under ABC evolution is consistent with the empirical data on the MHC (Richman 2000). (e) Deleterious mutations continue to accumulate in each haplotype, which might drive the birth and death process of multigene evolution (Nei & Rooney 2005). Brown circles, H1; red circles, H2; blue triangles, H3; green triangles, H4; pink squares, H5.

