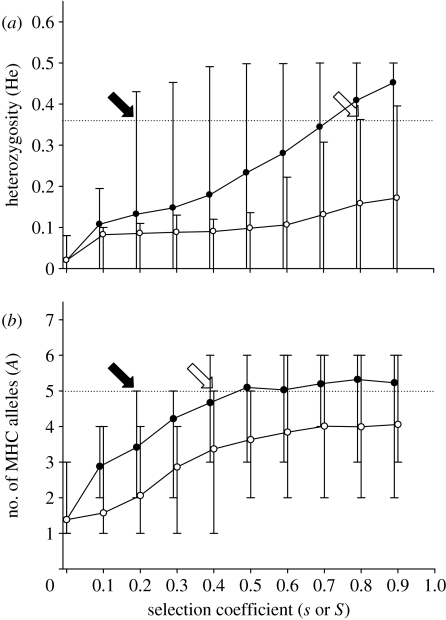
Figure 4.
Genetic diversity with ABC evolution (filled circles) and overdominant selection (open circles) in simulated fox and guppy populations across a range of selection coefficients. Selection coefficients necessary to explain the observed MHC diversity are considerably lower under continual selection with ABC evolution than under temporary overdominant selection. (a) Mean (5–95% CL) expected heterozygosity (He) at the MHC in simulated populations of the fox (U. l. dickeyi) after a two-generation single-pair bottleneck. The heterozygosity after the bottleneck (He=0.36, Aguilar et al. 2004) is indicated by the dotted line. Genetic polymorphism in simulated fox populations can be maintained with selection coefficients (s≥0.2) with ABC evolution (black arrow). However, considerably stronger selection (S≥0.8) is necessary to explain the observed gene diversity (open arrow), assuming that overdominant selection operates during the bottleneck generations only (Aguilar et al. 2004). (b) The mean (5–95% CL) number of simulated MHC alleles in samples of 21 guppies (P. reticulata) in populations under ABC evolution (purifying selection every generation) and overdominant selection (operating in alternating generations) (van Oosterhout et al. 2007a). The dotted line at A=5 shows the number of observed alleles at each locus (van Oosterhout et al. 2006). Selection coefficients s≥0.2 (ABC evolution, black arrow) and S≥0.4 (overdominance, open arrow) are required to explain the observed MHC polymorphism.

