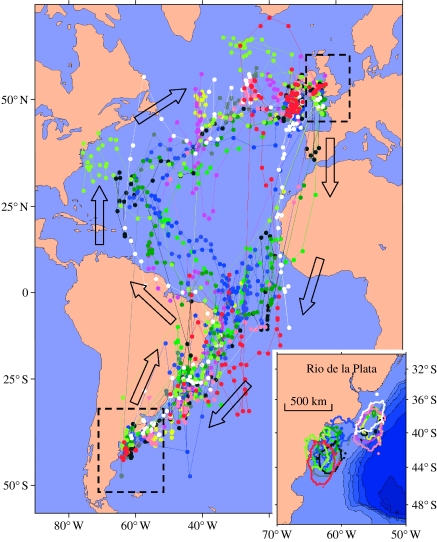
Figure 3.
Positions of 12 shearwaters tracked with geolocators. Each bird is represented by a different colour. Coloured lines serve to connect the positions in series providing approximate trajectories. However, where erroneous locations have been excluded, lines may sometimes connect neighbouring positions that are many days apart and hence are not indicative of actual routes travelled (e.g. over land). For clarity around the breeding colony and the main over-wintering area (inside the dashed boxes) where there is a high density of points, plots are of mean positions over two-week periods. The inset shows the 50% occupancy contours within the southern dashed box around the over-wintering area for all daily positions within that box, using the same colour scheme as the tracks. Bathymetry contours at 1000 m intervals indicate the edge of the Patagonian Shelf.

