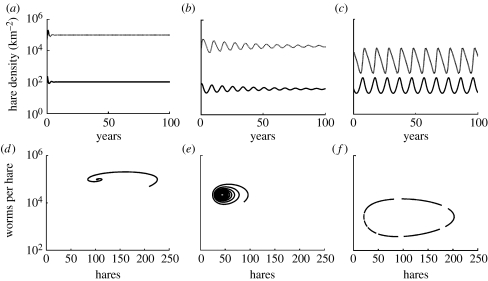
Figure 1.
Simulated population dynamics based on the empirical information available on the hare–parasite interaction. (a–c) Hare density, (d–f) worms per hare. The model was parametrized with (a) point estimates and (b) the modified parameter set chosen to be the best-fitting combination within the identified plausibility envelope. (c) Realistic population dynamics generated using a=1.8; b=0.61; δ=0.001; α=0.00004; and λ=600 (solid line, hares; dotted line, parasites). For the limit cycle in state space, the velocity within the limit cycle is indicated by the length of the dashes, one per year.

