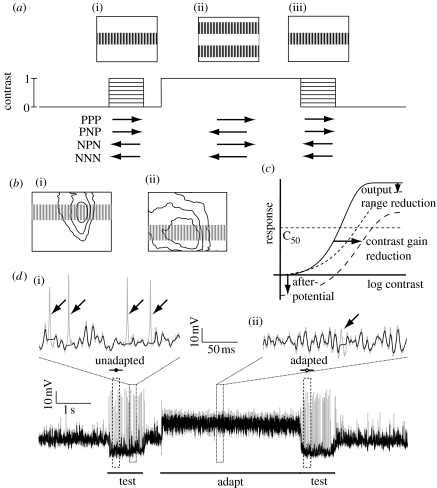
Figure 1.
Protocol for testing the local effects of motion adaptation. (a) Our test-adapt-test protocol uses an adapting sine-wave grating (0.1 cpd, 20 Hz, contrast=1.0) with a ‘notch’ in the middle, thus leaving a large part of the neuron unadapted. The test stimulus consists of a sine-wave ‘strip’ (0.1 cpd, 5 Hz) covering this unadapted part. We vary the test contrast in eight steps between 0 and 1.0. The testing and adapting stimuli are displayed in four combinations of preferred (P) and anti-preferred (null, N) directions of motion ((i, iii) test, 5 Hz; (ii) adapt, 20 Hz). (b) The test stimulus is placed over the centre of the receptive field of male (i) HSN and (ii) HSNE. The contour lines show 25, 50 and 100% sensitivity amplitude of averaged receptive fields (Nordström et al. 2008). (c) Diagram of the three motion adaptation components described by Harris et al. (2000), with the unadapted (solid curve), adapted (long-dashed curve) and normalized (short-dashed curve) responses shown. The after-potential shifts the curve vertically, while the contrast gain reduction generates a horizontal shift, and the output range reduction compresses the gain. (d) The data trace (grey) shows the intracellular response of a male HSN to the NPN protocol. The unadapted and adapted test response times are delineated (100–300 ms). For most analyses we use the graded membrane potential after removing spikelets (black trace). The two magnifications show the efficiency of such spikelet removal during (i) anti-preferred motion and (ii) preferred direction motion (arrows point to successfully removed spikelets).

