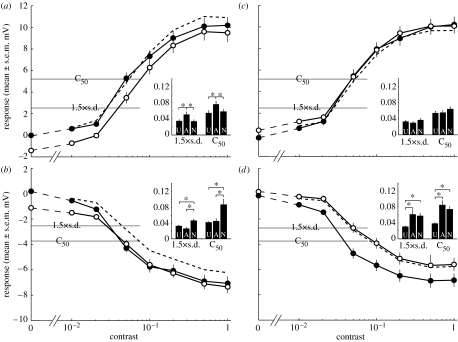
Figure 2.
Local adaptation generates little contrast gain reduction. The graphs show the contrast sensitivity functions to the four test-adapt-test combinations: (a) PPP (preferred direction test and adapt), (b) NPN (anti-preferred direction test, preferred direction adapt), (c) PNP (preferred direction test, anti-preferred direction adapt) and (d) NNN (anti-preferred direction test and adapt) to the strip test and notch adapt stimuli. Unadapted (U; filled circles) refers to the response to the first test, and adapted (A; open circles) to the second test, after adaptation has taken place. The dashed lines (normalized, N) show the adapted response after subtracting the after-potential, i.e. the adapted response to a test contrast of zero. We use two measures to determine shifts in contrast sensitivity: C50 is calculated as the contrast that gives 50% maximum response (defined as the unadapted response to a test contrast of 1.0) and 1.5×s.d. is a ‘detectability’ criterion based on the standard deviation of the unstimulated membrane potential. The inset histograms show the contrast measured at C50 and 1.5×s.d. after fitting the data with a spline function. All data are displayed as mean±s.e.m., n=15. Asterisks indicate significant differences (p<0.05).

