Figure 3.
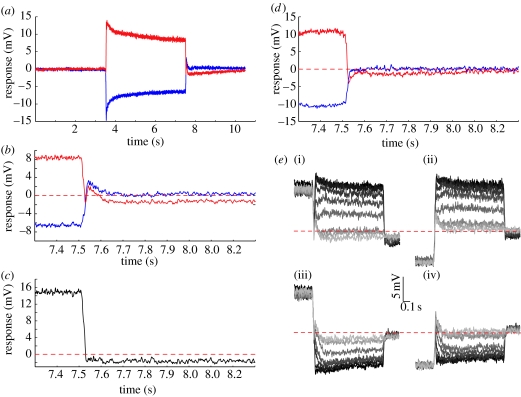
The antagonistic after-potential. (a) Average responses to adaptation (‘notch’ stimulus) in the preferred (red curve) and anti-preferred (blue curve) direction when the test contrast is zero. (b) A magnification of the responses surrounding the offset of adaptation (at 7.5 s) shows the asymmetry of the transient. (c) Responses to anti-preferred adaptation subtracted from those to preferred adaptation, and magnified around the offset of adaptation (at 7.5 s). (d) Average responses when adaptation is followed by a stationary test (0.1 cpd, contrast=1), magnified around the offset of adaptation (at 7.5 s). (e) Adapted responses following preferred adaptation ((i) PPP and (iii) NPN) and anti-preferred adaptation ((ii) PNP and (iv) NNN). The traces are shaded to illustrate the eight contrasts used (contrast of 0=lightest grey, to a contrast of 1.0=black). In (a–e), responses are averaged across 15 neurons, except in (d) where n=3.

