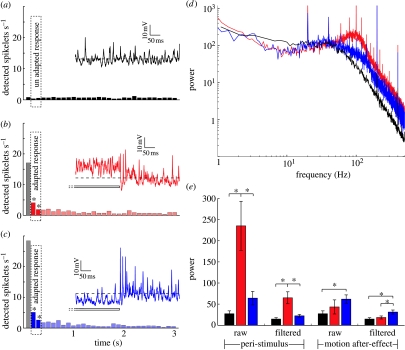
Figure 4.
Spikelets shape the response profile during and after stimulation. (a) Average number of spikelets detected during 3 s in the unstimulated neuron. The spikelets are displayed in 100 ms bins (n=17). The inset shows the unadapted membrane potential of an individual HSN (same neuron as in figure 1d). (b) Average number of spikelets detected during 3 s following adaptation in the preferred direction. The first bin is greyed out owing to the presence of the non-directional depolarizing transient with associated spikelets described in figure 3. The spikelets are displayed in 100 ms bins, with bins from the 100–300 ms time period highlighted. Asterisks indicate significant difference compared with the unadapted neuron for these two bins (p<0.001, n=17). Inset shows 0.5 s of the response surrounding preferred direction motion offset in the same HSN. (c) Average number of spikelets detected during 3 s following adaptation in the anti-preferred direction. Spikelets are displayed in 100 ms bins, with bins from the 100–300 ms time period highlighted. Asterisks indicate significant difference compared with the unadapted neuron (p<0.001, n=17). The inset shows 0.5 s of the response surrounding anti-preferred direction motion offset. (d) FFT of raw data shows the power spectral density before (black curve, control; no stimulus) and during preferred (red curve) and anti-preferred (blue curve) direction adaptation (when there was no test, n=9). (e) Averaged power at 95–105 Hz before (control, black bars), during (peri-stimulus) and after adaptation (red bars, preferred direction motion; blue bars, anti-preferred motion). In each case, we show the power of the raw and the filtered (spikelets removed) data. Asterisks indicate significant differences (p<0.05, n=9).

