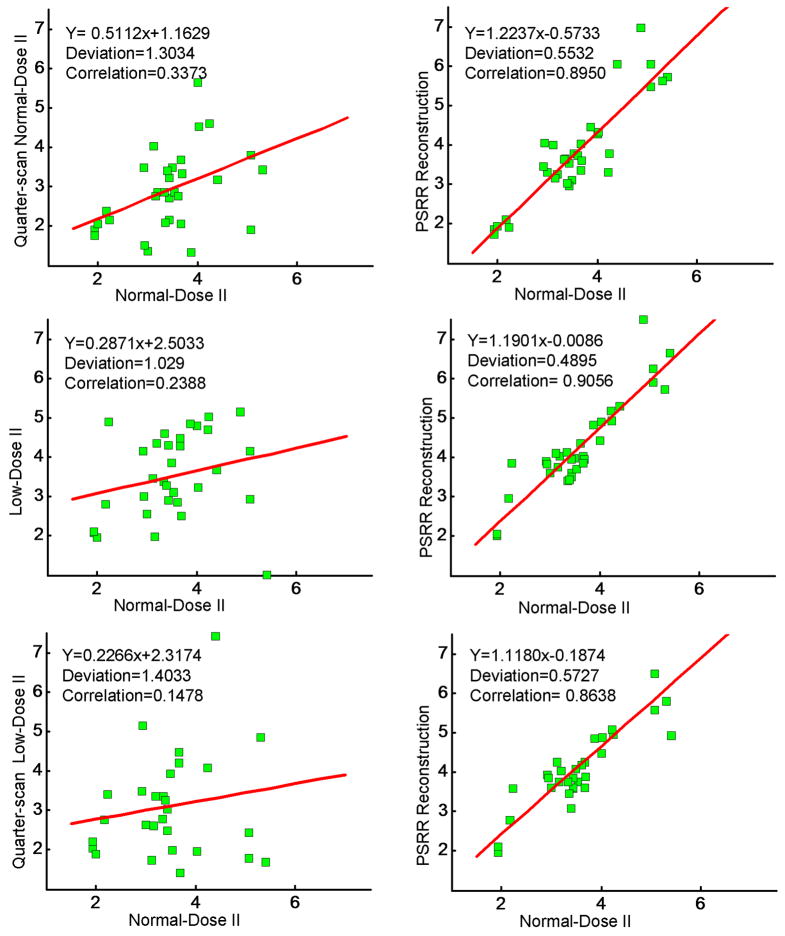
Figure 8.
MTT repeatability analysis (Unit: second (s)). The left column is the repeatability of the reconstruction without the regulation of a previous scan data, while the right column is with our PSRR method. The first row plots the results of quarter-scan Normal-Dose II with simulated noise, the second row is for Low-Dose II, and the third row for quarter-scan Low-Dose II.

