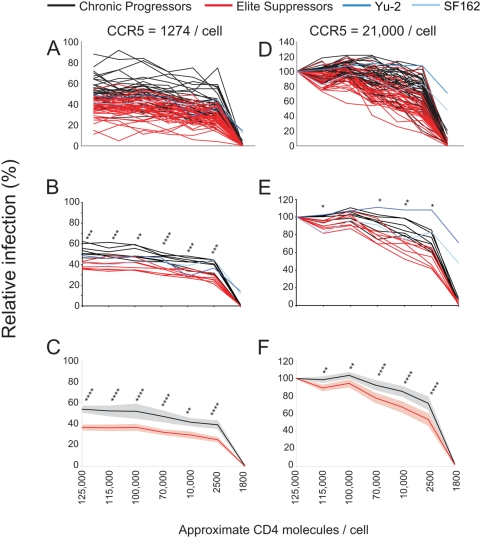
Figure 2. ES clones show reduced entry efficiency at fixed CCR5 surface concentrations.
(A–C,D–F) Affinofile cells were induced to express approximately 1274 CCR5 molecules/cell (A–C) or approximately 21,073 CCR5 molecules/cell (D–F) and CD4 molecules ranging from approximately 1,800 to 125,000 molecules/cell prior to infection. Induced Affinofile cells were infected with equivalent amounts of pseudotyped viruses. Relative infection of all CP (black) and ES (red) clones are shown with SF162 and YU-2 included as positive controls (blue). Relative infection is expressed as a proportion of maximal infection at the highest CD4 (approximately 125,000 molecules/cell) and CCR5 (approximately 21,073 molecules/cell) level. (B,E) Infectivity of clones from individuals were averaged and plotted as a single line for chronic and ES individuals. P values are given for patient averages. (n = 7) (C,F) Average of all individual chronic or elite clones at minimal (C) and maximal (F) CCR5 concentrations with CD4 concentrations ranging from approximately 1,800 to 125,000 molecules/cell. Affinofile cells were induced as described above for (A,B). P values as calculated by unpaired student's t test are shown above each CD4 expression condition. P values are represented as follows: P<0.05 (*), P<0.01 (**), P<0.001 (***), P<0.0001 (****). 95% confidence intervals are shown for chronic (grey) and ES (pink).

