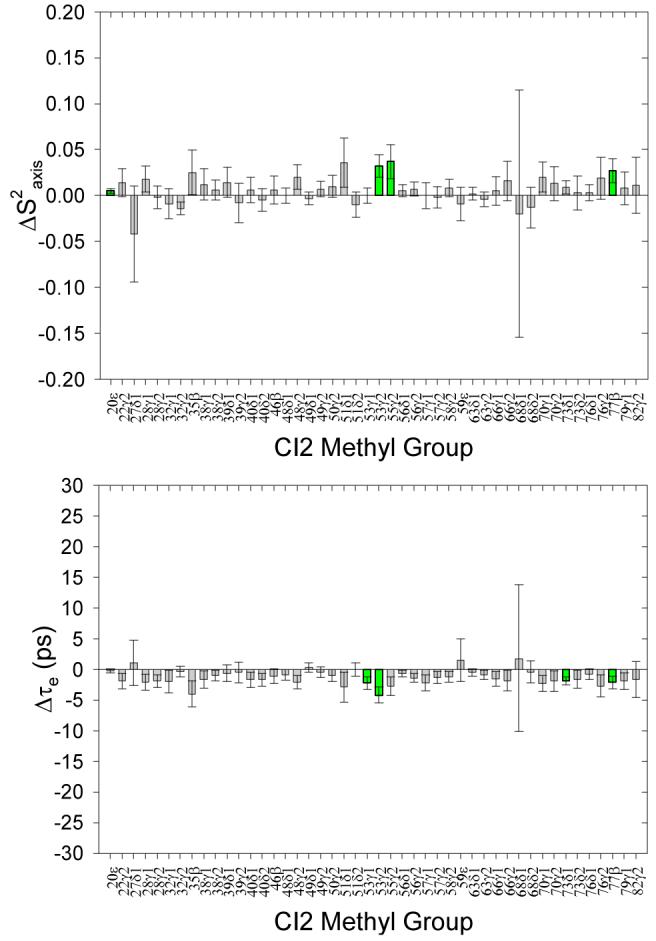
Figure 3.

Control analysis of side-chain model free dynamics parameters extracted from independent replicate 2H relaxation measurements of different WT CI2 samples. For nearly every methyl group, the differences between the extracted S2axis and τe parameters for the two replicate sets of data are zero, within error. The very few small differences deemed significant are consistent with our 2σ standard and are colored green.
